
Any computer user knows that troubles will eventually arise, no matter what kind of computer they are using, Windows or Mac. Fortunately, Mac users have a tool built into MacOS that they can use to troubleshoot many issues that arise: Activity Monitor.
How to Use Activity Monitor to Troubleshoot Your Mac
In this article we will go through several aspects of the Activity Monitor including how to locate it, the various tabs of it, and how to use it to troubleshoot your Mac computer.
Where Is Activity Monitor Located on Your Mac?
Lets start by locating Activity Monitor on your Mac (using OS Ventura).
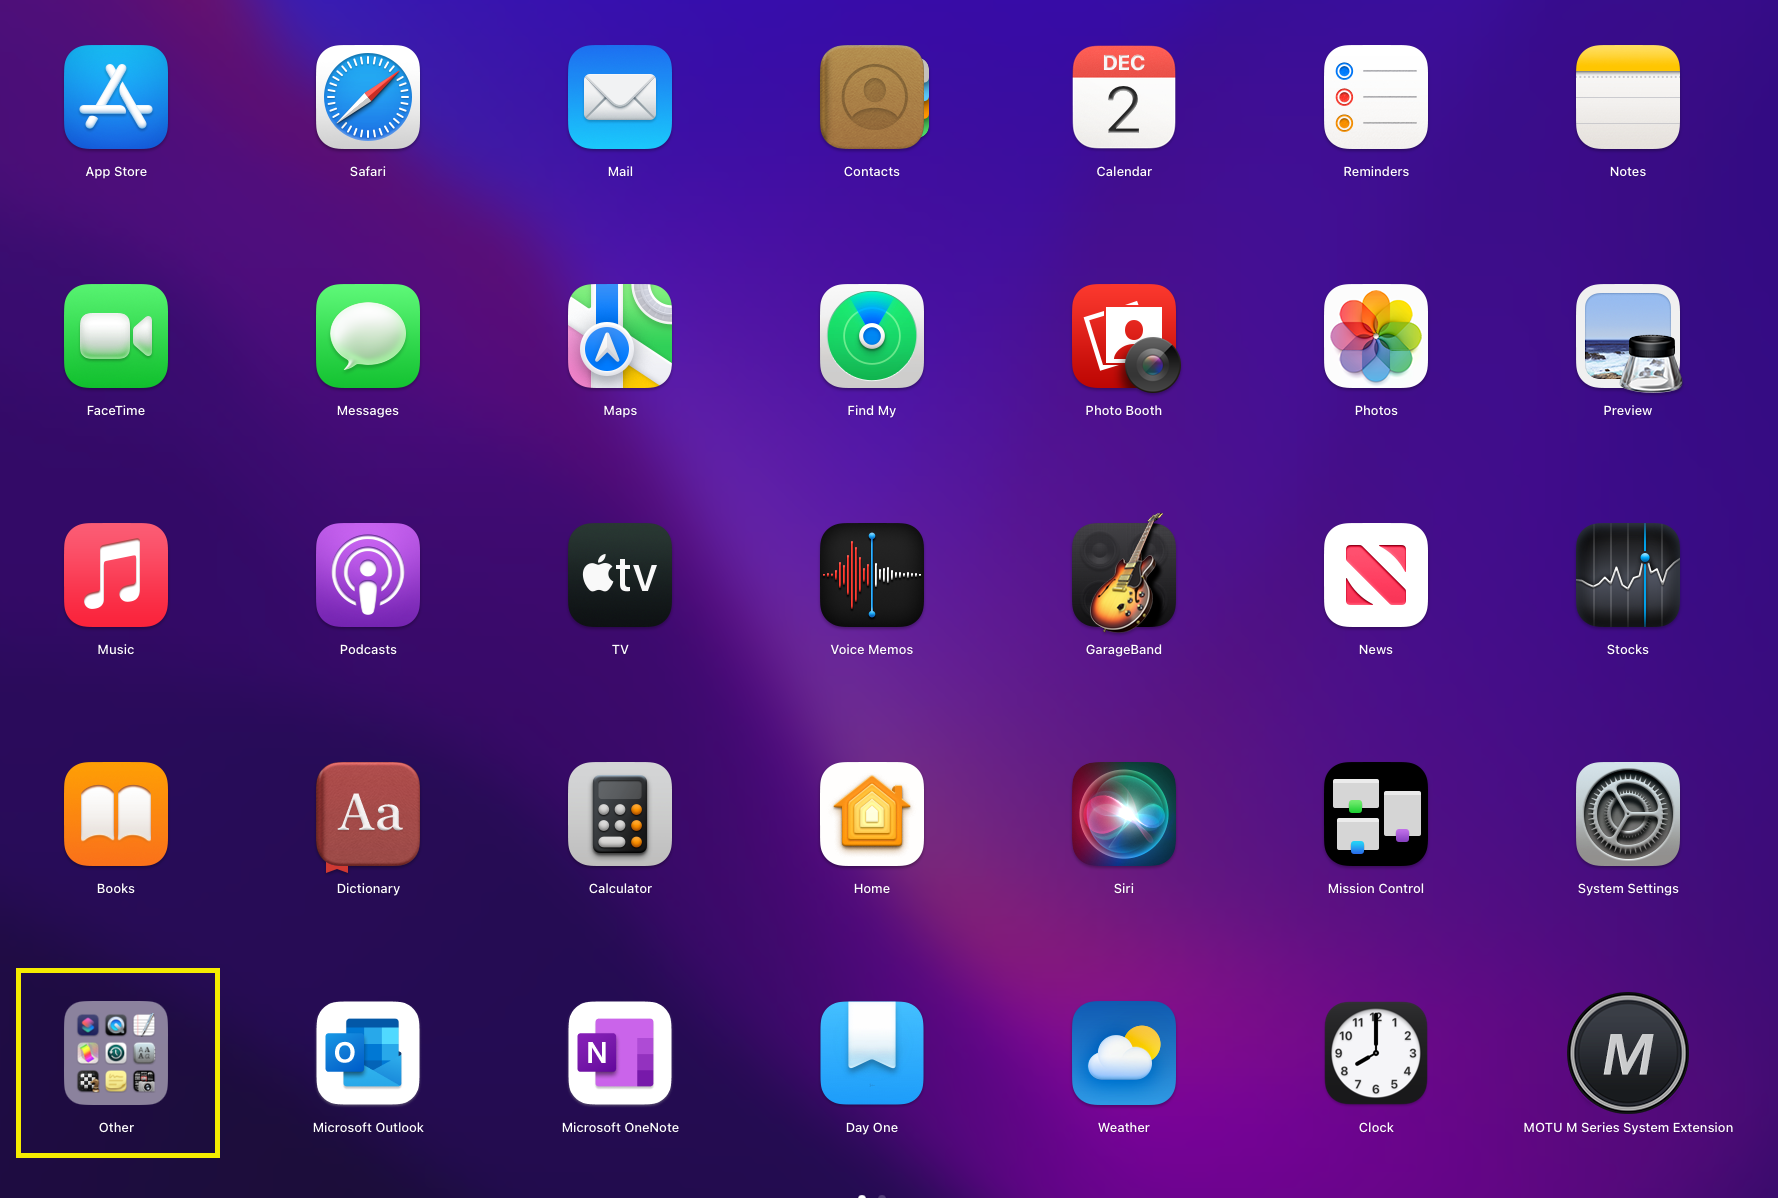
- Open Launchpad
- Click on Other
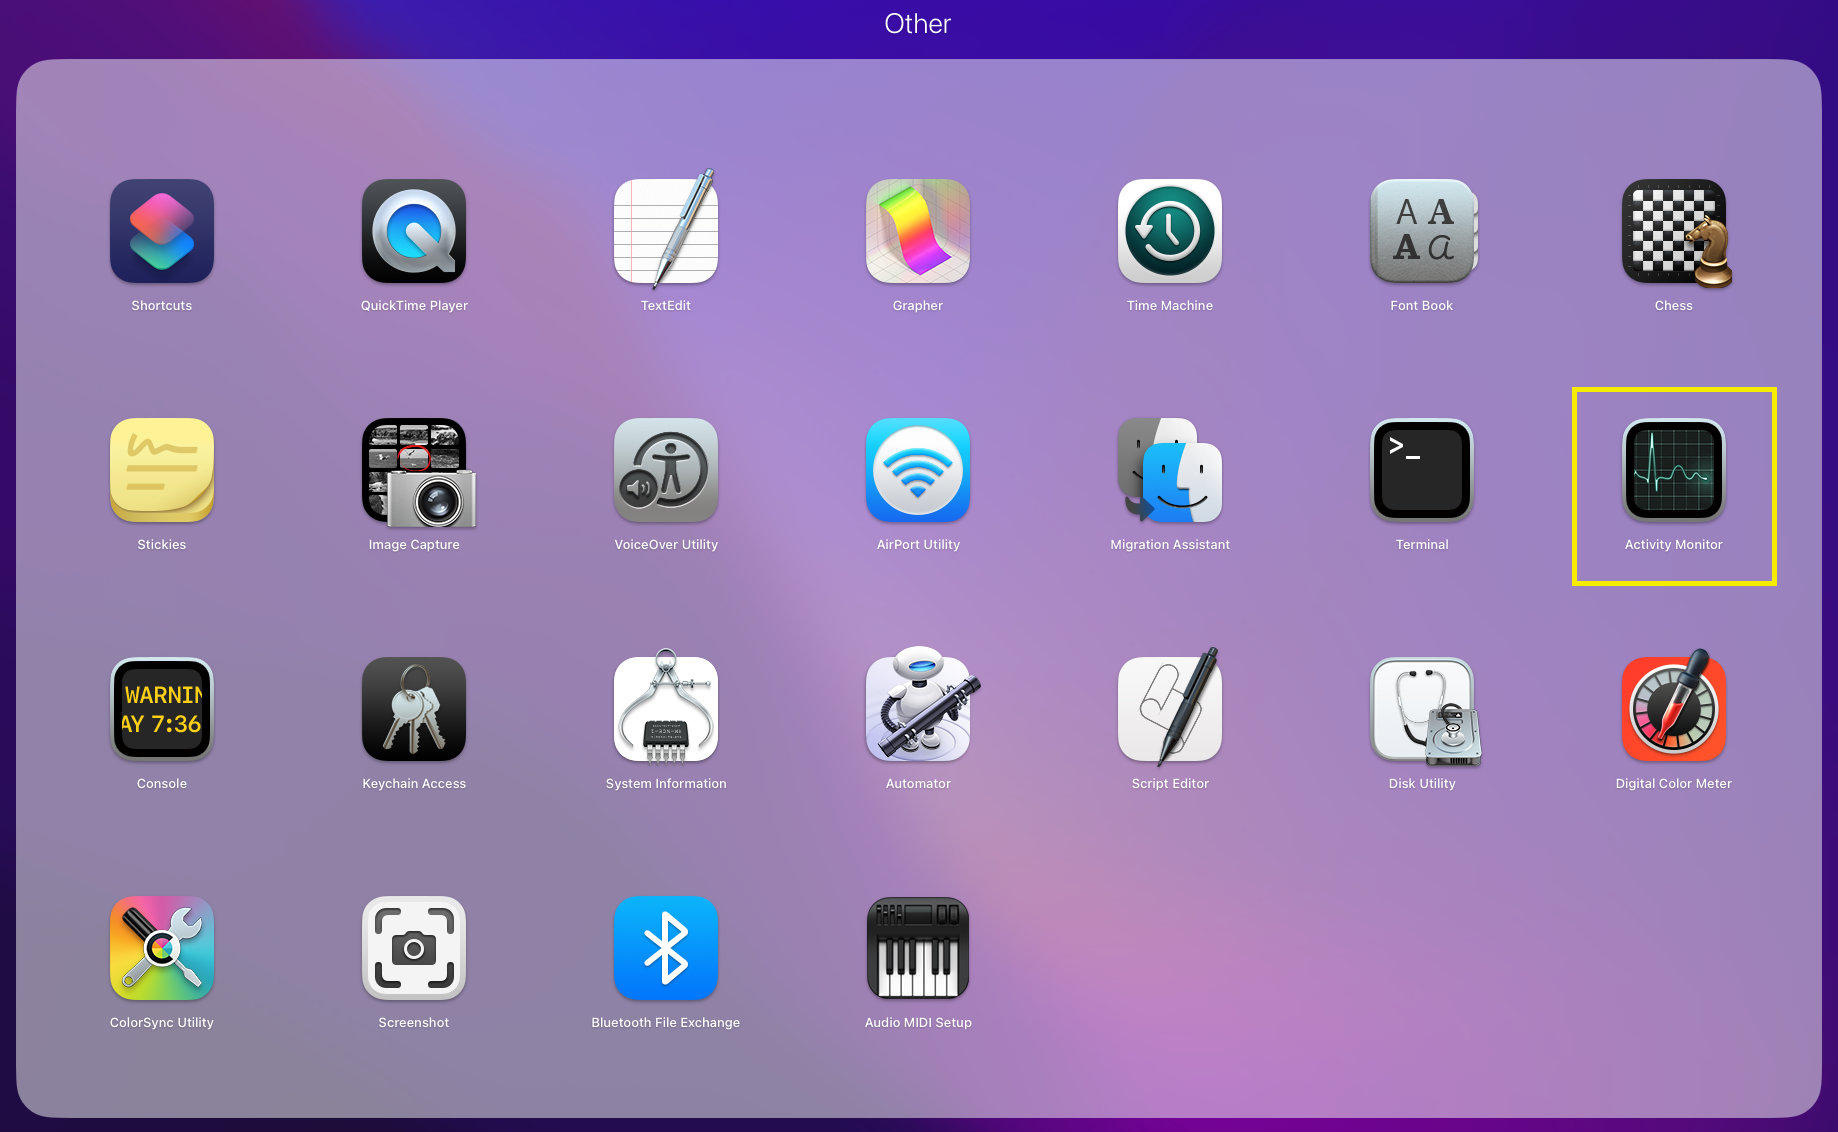
3. Under Other you will find Activity Monitor
What is Activity Monitor?
Activity Monitor is a tool for troubleshooting issues that might be affecting your Mac computer. Essentially it is a dashboard that tells you all of the processes, cpu resources, energy, and network resources your computer is using. It can be, however, somewhat advanced for beginner-level computer users and those that are unfamiliar with what they are looking for when using it. Lets dive into Activity Monitor and learn how to use this excellent tool to solve issues that might be affecting our Mac.
Activity Monitor gives the user information (sorted into tabs) about several primary resources used by their Mac:
- CPU Use
- Memory (RAM) Use
- Energy Consumption
- Bytes Written to Disk
- Network Processes
CPU Tab
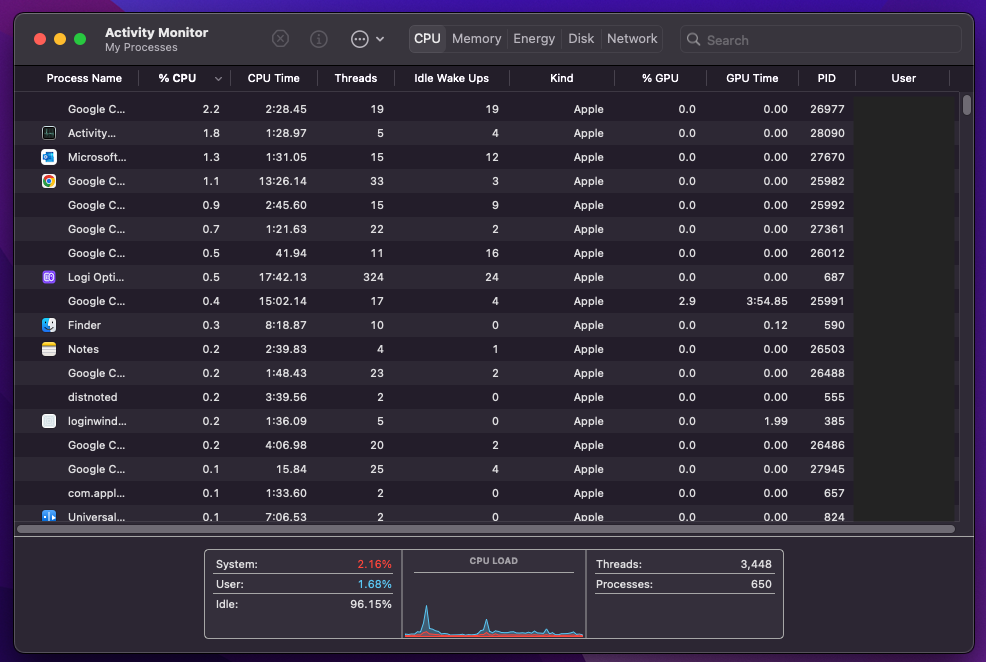
The % CPU column of the Activity Monitor tells you how hard each of your running applications and processes are working by a percentage of your Central Processing Units capacity. Keep in mind, your CPU likely has multiple cores so if you see 100%, that simply means one of your cores are being 100% utilized.
In the % GPU column you can see a similar stat for your Graphics Processing Unit. This column tells how much of your GPU is being utilized at any given time and what process is using it.
These are the two columns you will mainly be concerned with when looking at the CPU tab of the Activity Monitor. You can organize each of the columns from greatest to smallest to easily see which processes are taxing your CPU or GPU if your Mac is running slowly or causing the fan to come on to cool the computer down.
Memory Tab
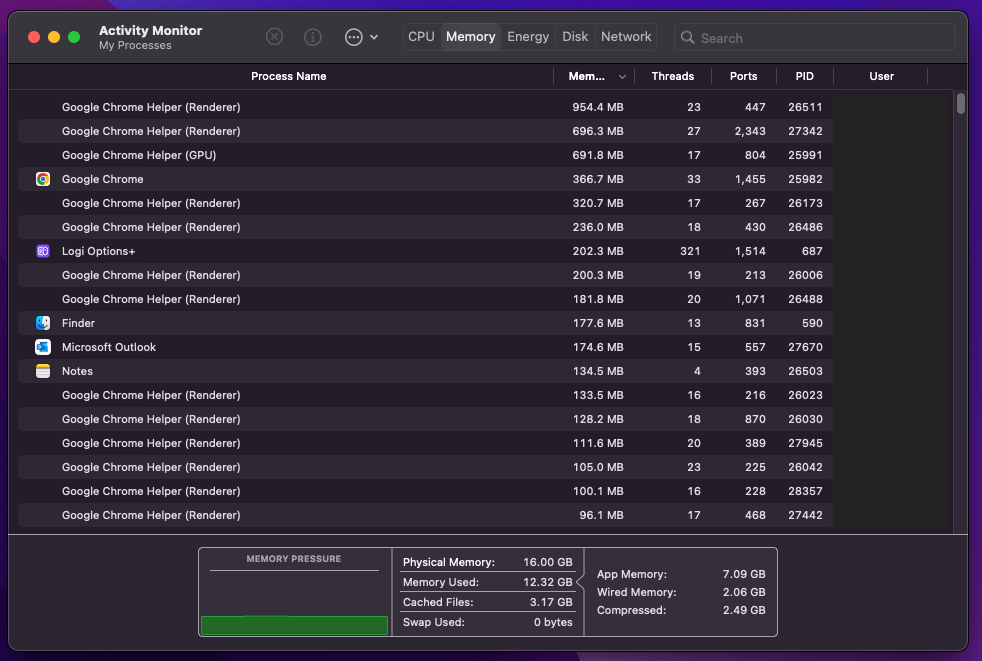
In short, the Memory tab of the Activity Monitor tells how much memory (RAM) is being used by your processes and applications. Often this list of processes and applications is a good indicator of what you need to close if your computer is running slowly, or you are getting the dreaded Apple spinning wheel.

You can see from the image below that Google Chrome is using the most memory of the applications currently running, while Logi Options, Finder, Microsoft Outlook, and Notes are also using memory. From this list we can determine that if our Mac is beginning to run slowly, we might want to close some Google Chrome windows to save some Memory resources.
Energy Tab
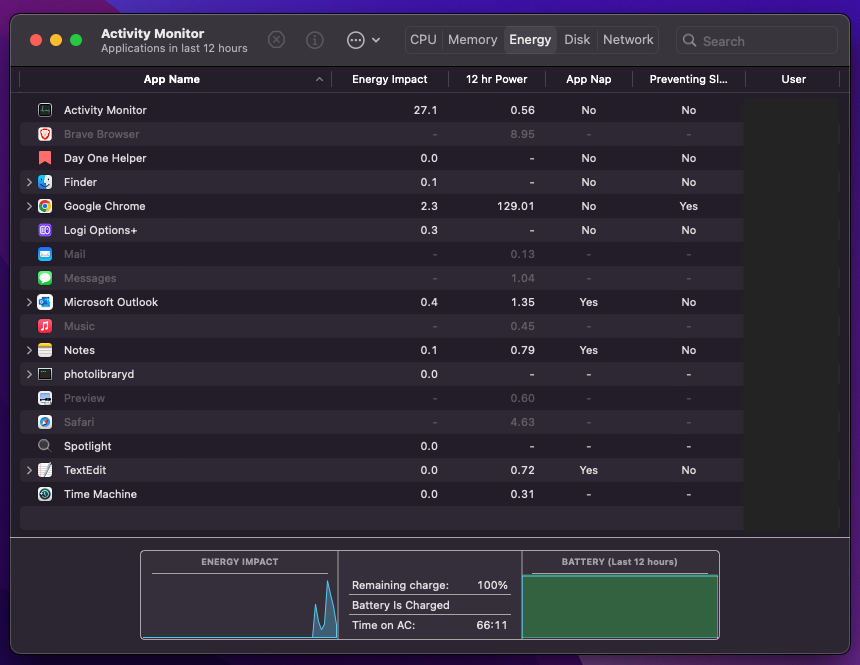
The Energy tab gives information on how much energy is being used by the applications you are currently running. If you are using an iMac, Mac Mini, Mac Pro, or Mac Studio this is not really going to be as much of a concern for you since you will be plugged into an outlet all the time. However, if you are using a Mac laptop such as an MacBook Air or MacBook Pro, this will show you where the bulk of your battery usage is coming from. You can use this information to conserve battery life during long days on the go.
Disk Tab
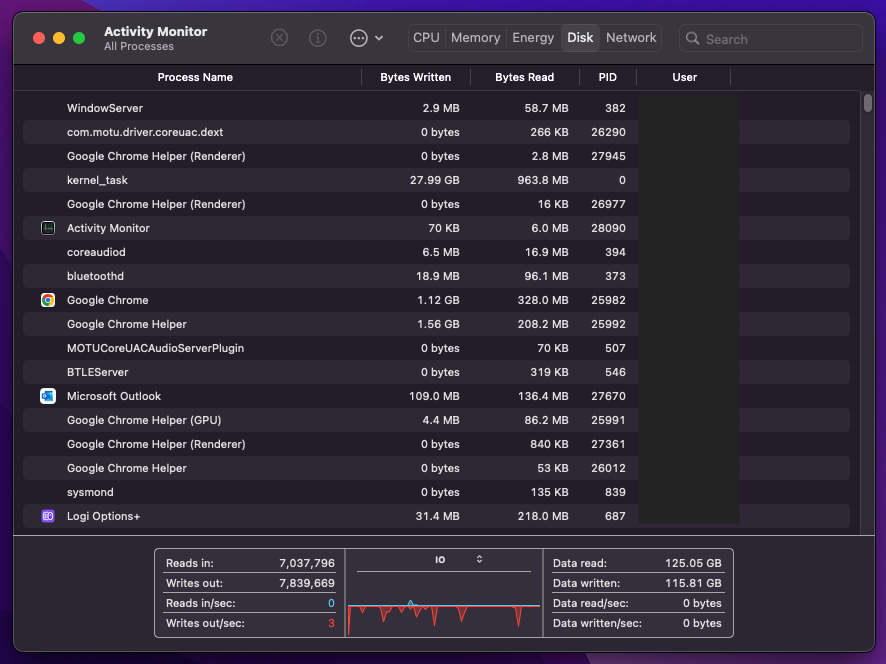
The Disk tab displays information pertaining to how much data has been read from and written to your storage device - usually the built-in SSD in your Mac. You can use the Disk tab to evaluate how well your storage media is working in your Mac computer.
If you are experiencing performance issues, there is a chance it could be due to excessive disk utilization. In this case, you would want to monitor the Reads in/sec: and Writes out/sec: values while certain applications are running to see if you can detect an issue.
Network Tab
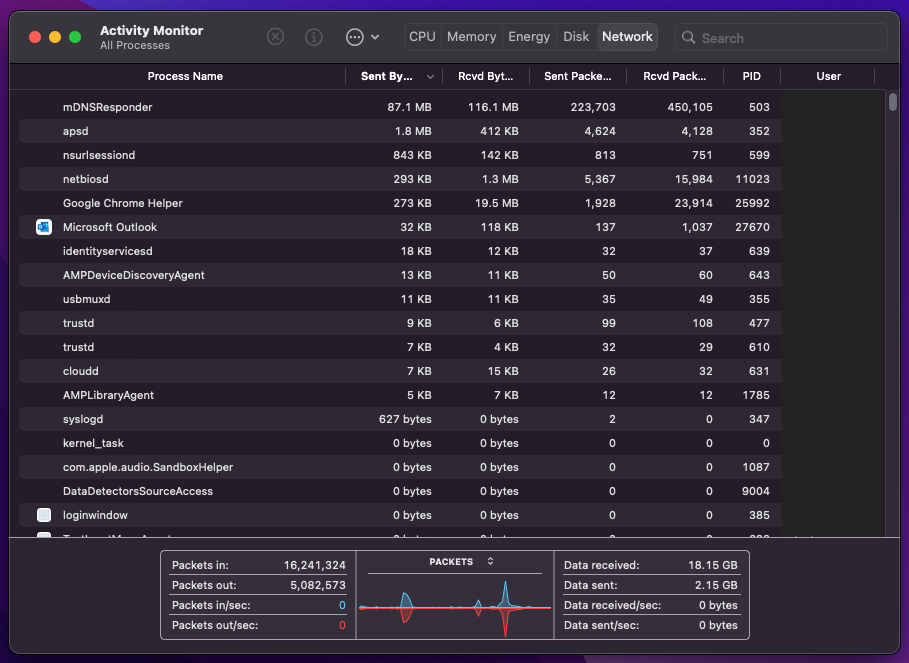
The Network tab shows how much data is flowing in and out of the network interfaces for currently running applications and processes. This tab can be used to see which apps are the heaviest users of your network. This can be helpful for users who have a limited data plan and need to monitor their network usage.
The Network tab can also be helpful if you are having network issues due to certain applications hogging the bandwidth. If you have a slower internet connection, this can be especially helpful as you will want to know what applications are slowing your connection down.
The Network tab not only shows the data that is flowing in and out from the internet, but also data that is flowing across your local area network. If you have a home network and you transfer data across devices, that information will show up here if it is moving to/from your Mac computer.
Closing
Activity Monitor is a very helpful tool that is built in to your Mac to help you determine the cause of many issues that can affect your CPU, memory usage, battery consumption on a laptop, and even your network speed. Learn it and check it often to troubleshoot issues that can affect your Mac experience.